TL;DR:
- Website user experience impacts conversion rates more than aesthetics by revealing hidden friction points. Prioritizing measurable UX diagnostics like heuristic evaluation, usability testing, and performance metrics ensures targeted improvements that drive business results. Continuous analysis with tools like Lighthouse and benchmarking helps align website performance with industry standards and user expectations.
Your website may look polished and professionally designed, yet still lose prospects at every critical touchpoint. This happens more often than most business owners realise, and the root cause is rarely aesthetics. It is hidden friction within the user experience that silently erodes engagement, undermines trust, and kills conversions before a visitor ever reaches your call to action. Understanding the mechanics of website user experience (UX) and applying evidence-based methodologies to measure and improve it is no longer optional. It is the strategic lever that separates businesses that grow online from those that merely exist there.
Table of Contents
- Why website user experience matters for business results
- Core UX methodologies: From usability to performance metrics
- Using tools like Lighthouse and analytics for practical improvements
- Benchmarking and journey analytics: Measuring what really drives conversion
- The website UX myth: Why good looks alone don’t deliver conversions
- Take your website user experience to the next level with expert help
- Frequently asked questions
Key Takeaways
| Point | Details |
|---|---|
| UX drives conversions | Improving user experience can significantly increase engagement and conversions for your business website. |
| Choose the right UX method | Set your main metric first, then select usability and performance tools that align with your conversion goals. |
| Validate with real users | Back up tool results with field data and real user testing to avoid costly blind spots. |
| Benchmark for progress | Use industry benchmarks and journey analytics to measure and focus your improvement efforts. |
Why website user experience matters for business results
Website user experience, in practical business terms, refers to every aspect of how a visitor interacts with your site, from how quickly pages load and how intuitively navigation flows, to whether the content answers their questions at the right moment. It is not simply about visual appeal. UX encompasses the emotional and functional quality of every touchpoint a prospect encounters on their journey toward a conversion action.
The business case for prioritising UX is direct and well-supported by data. Conversion is sensitive to UX friction and experience quality, meaning that even marginal improvements in usability can produce measurable lifts in revenue and lead generation. When friction is high, whether due to slow load times, confusing navigation, or unclear calls to action, visitors abandon the journey and rarely return. The cost of that friction accumulates across thousands of sessions each month.
Consider what drives prospects to disengage:
- Slow page load times that exceed visitor patience thresholds, particularly on mobile devices
- Confusing navigation structures that force users to hunt for information instead of finding it naturally
- Forms that are too long or poorly designed, creating cognitive load at the most critical conversion point
- Lack of trust signals such as security badges, client testimonials, or clear contact information
- Poor mobile responsiveness that degrades the experience on smartphones and tablets
“The experience a visitor has on your website is not a soft, subjective concern. It is a direct determinant of whether they convert, return, or choose a competitor instead.”
Understanding web design UX best practices gives your business a structured starting point for identifying and resolving these failure points. Similarly, mastering web usability essentials helps you approach your site not as a static brochure, but as a dynamic conversion system that requires regular evaluation.
Core UX methodologies: From usability to performance metrics
With the importance of UX firmly established, the next question for most business owners is: how do you actually diagnose and improve it in a rigorous, repeatable way? Professional UX work draws on a set of proven methodologies, each serving a distinct diagnostic purpose.
Heuristic evaluation is one of the most efficient starting points. It is a structured expert review of your website measured against established usability principles, such as consistency, error prevention, and recognition over recall. Heuristic evaluation is a recognised methodology for finding usability problems quickly, without requiring large user panels or lengthy testing cycles. For business owners, this translates into a cost-effective first pass that reveals systemic design issues before investing in broader user research.
Usability testing goes further by observing real users attempting to complete specific tasks on your site. This method generates qualitative insights, revealing exactly where users hesitate, misunderstand, or abandon a process. While heuristic evaluation identifies structural problems, usability testing validates whether proposed solutions actually work in practice.

Performance engineering metrics form the third pillar, encompassing quantitative indicators such as page load speed, time to interactive, accessibility scores, and core web vitals. High-quality website UX combines usability methods, performance metrics, and analytics linking experience to conversion, providing a complete diagnostic picture rather than an isolated snapshot.
Here is a direct comparison of the three primary UX assessment approaches:
| Method | What it diagnoses | Best used for | Typical output |
|---|---|---|---|
| Heuristic evaluation | Structural usability issues | Early-stage audits, redesigns | Prioritised issue list |
| Usability testing | Real user behaviour and friction | Validating designs, pre-launch | Task completion data, user quotes |
| Performance diagnostics | Speed, accessibility, SEO signals | Ongoing monitoring, technical fixes | Quantitative scores, issue reports |
| Journey analytics | Drop-off points, funnel behaviour | Conversion optimisation | Funnel maps, segment data |
A structured approach to applying these methods follows a logical sequence:
- Define your objective metrics first, including target conversion rate, task success rate, and acceptable load time.
- Conduct a heuristic evaluation to identify obvious structural friction.
- Use performance diagnostics to quantify technical barriers.
- Run usability testing to observe real users navigating your site.
- Analyse journey analytics to map where and why visitors disengage.
- Prioritise fixes based on impact on your defined business metrics.
Pro Tip: Resist the temptation to select your UX improvement method before defining what success looks like. Setting objective, measurable targets first ensures that every diagnostic effort is aligned with actual business outcomes rather than subjective design preferences.
Exploring UX design strategies that connect methodology to business value helps you move beyond theoretical frameworks and into actionable improvement cycles. Investing in custom UX improvements tailored to your specific audience and industry context consistently outperforms generic template-based approaches.
Using tools like Lighthouse and analytics for practical improvements
Once you understand the methodology landscape, the next step is selecting the right tools to operationalise your UX assessment. Google Lighthouse is one of the most widely adopted instruments available to business owners and development teams alike.
Lighthouse is an open-source automated auditing tool that reports on performance, accessibility, best practices, and SEO across five key audit categories. It runs directly in Chrome DevTools or as a command-line utility, generating a scored report that highlights specific issues along with actionable recommendations for resolving them. For a business owner, this means you can audit your own site in minutes and receive a prioritised list of technical problems, without requiring deep coding knowledge to interpret the output.
Here is a practical breakdown of what Lighthouse diagnoses versus what analytics platforms reveal:
| Diagnostic area | Lighthouse reveals | Analytics reveals |
|---|---|---|
| Page load speed | Exact load time, render-blocking resources | Which pages users abandon due to slowness |
| Accessibility | Missing alt text, contrast ratios, ARIA labels | Which user segments disengage (indirectly) |
| SEO signals | Meta descriptions, mobile-friendliness, structured data | Organic traffic volumes, bounce rates |
| Best practices | HTTPS usage, deprecated APIs, image formats | Not directly visible |
| User behaviour | Not applicable | Click paths, session duration, exit pages |
This comparison illustrates a critical limitation: Lighthouse is a lab-based tool. It simulates user conditions rather than capturing real visitor behaviour on your live site. A page might score well in a Lighthouse audit yet still perform poorly for actual users experiencing variable network conditions, different devices, or high concurrent traffic loads.
Key actions for business owners using Lighthouse effectively:
- Run audits on mobile settings, since mobile visitor shares continue to grow and mobile UX often diverges significantly from desktop performance.
- Focus on the Opportunities and Diagnostics sections, which provide specific, implementable fixes rather than just scores.
- Track scores over time to measure the impact of development changes and catch regressions early.
- Cross-reference Lighthouse findings with real analytics data to confirm whether a flagged issue is actually affecting user behaviour on your live site.
Pro Tip: Before acting on a Lighthouse recommendation, validate it with real user data. A technically suboptimal element that users interact with seamlessly may warrant lower priority than a technically clean page where analytics shows a consistent drop-off pattern.
Resources on mastering web UX in a development context provide deeper guidance on integrating automated auditing into your ongoing workflow. Combining tool-based audits with effective UX design tips rooted in real-world design principles gives your team a balanced, evidence-driven approach.
Benchmarking and journey analytics: Measuring what really drives conversion
Knowing your site’s individual performance scores is valuable, but understanding how those scores compare to industry standards, and how user journeys connect to actual business outcomes, is where UX strategy becomes genuinely powerful.
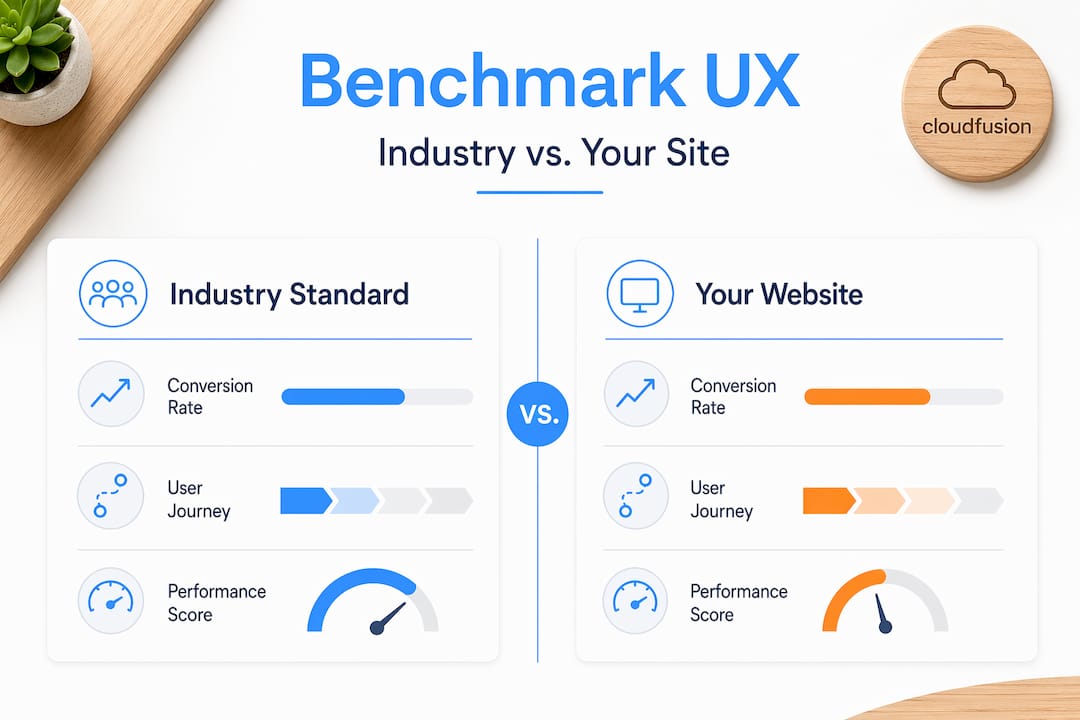
UX benchmarking with research-backed datasets enables comparison against industry standards, giving your team a reference point that transcends internal assumptions. Rather than judging your conversion rate in isolation, benchmarking reveals whether you are operating above or below the median for your sector, device type, and visitor segment. This context transforms raw data into actionable intelligence.
Benchmarking is most useful when mapping UX issues to journey stages and conversion metrics. A high exit rate on a product page, for instance, means something very different than a high exit rate on a checkout confirmation page. Mapping friction to specific journey stages allows you to prioritise fixes where the commercial impact is highest.
Key metrics every business owner should monitor to drive UX-informed decisions:
- Traffic quality indicators: New versus returning visitor ratios, traffic source breakdowns, and device type distributions
- Engagement depth metrics: Average session duration, pages per visit, scroll depth, and interaction rates on key conversion elements
- Conversion funnel performance: Step-by-step drop-off rates across forms, checkout flows, and enquiry paths
- Frustration signals: Rage clicks (repeated rapid clicks indicating confusion), error encounters, and dead-end navigation paths
- Retention and loyalty metrics: Return visitor rates, time between sessions, and repeat conversion patterns
“A ‘good’ conversion rate is not a universal number. What counts as strong performance varies by industry, traffic source, device, and visitor intent stage. Without the right benchmarks, you are optimising against the wrong target.”
The practical implication here is significant. A retail ecommerce site, a professional services firm, and a SaaS product have fundamentally different conversion journeys and baseline expectations. Applying retail ecommerce benchmarks to a professional services website produces misleading conclusions and misdirected optimisation efforts.
Acting on journey analytics requires connecting each identified friction point to a specific business outcome. A 40% drop-off rate on your contact form matters because it represents a definable volume of lost leads per month. Quantifying that loss, in both sessions and estimated revenue, creates the business case for investing in UX improvements with measurable return on investment.
Strategies for SME UX optimisation provide practical guidance scaled to the resource realities of growing businesses. Understanding the specific levers for improving conversions through digital solutions ensures that every UX investment is directed toward outcomes that matter to your bottom line.
The website UX myth: Why good looks alone don’t deliver conversions
Here is an uncomfortable truth that the web design industry rarely states plainly: the majority of website redesigns fail to deliver meaningful conversion improvements, not because the new design is unattractive, but because the redesign process focused on aesthetics rather than friction removal.
We have seen this pattern consistently. A business invests significantly in a visually stunning new website. The colours are on-brand, the imagery is professional, the layout is modern. Six months later, conversion rates have not improved. In some cases, they have declined because the new design introduced navigation changes that disrupted the habits of existing users.
The underlying problem is that design-led redesigns typically address symptoms rather than causes. If users were abandoning your enquiry form at step three of four, making the form look more attractive does not resolve the friction that caused the abandonment. Understanding why they left, whether due to an unclear field label, an unexpected required field, or a lack of trust signal at that specific moment, is what enables a targeted fix.
Real UX leverage comes from treating your website as a continuously evolving system, not a one-off project with a launch date. The businesses that consistently outperform their sectors online share one characteristic: they maintain an ongoing analytics practice that connects UX data to business outcomes on a regular basis, not annually during a redesign cycle.
“The uncomfortable truth is that UX is a discipline, not a deliverable. It demands continuous measurement, iteration, and alignment with evolving user expectations and business goals.”
Embracing UX as a strategic discipline rather than a project milestone fundamentally changes how your digital investment delivers returns over time.
Pro Tip: Before your next redesign, audit your existing site with real user data and a heuristic review. You may find that targeted fixes to three or four high-friction points deliver greater conversion gains than a full visual overhaul, at a fraction of the cost and risk.
Take your website user experience to the next level with expert help
Understanding UX methodology is the first step. Implementing it with precision, at the speed your business requires, demands experienced partners who combine technical depth with strategic insight. At CloudFusion, our custom web development work is built on evidence-based UX principles, ensuring that every site we deliver is engineered for engagement and conversion, not just visual appeal. Our branding expertise ensures that your visual identity and your user experience reinforce each other cohesively. If you are ready to move from insight to implementation, connect with our team through our web design and development consultation and take the first concrete step toward a website that delivers measurable business results.
Frequently asked questions
What is the most effective way to measure website user experience?
Combining usability testing, performance diagnostics, and journey analytics yields the clearest picture of website user experience, since high-quality UX assessment links usability methods, performance metrics, and analytics to actual conversion outcomes.
How can I tell if UX friction is hurting my conversions?
Track user journeys with analytics and compare conversion rates across visitor types, devices, and journey stages. Comparing conversion outcomes across these dimensions quickly surfaces the drop-off points where friction is costing you the most.
Is Google Lighthouse enough to assess my website’s user experience?
Lighthouse reveals specific, actionable site issues across performance, accessibility, and SEO categories, but it is a lab-based tool. Combining its reports with field-based performance data from real users provides a far more accurate and complete assessment.
What benchmarks should I use to compare UX performance?
Use research-backed industry benchmarks that include traffic quality, engagement depth, conversion funnel performance, and retention metrics. Research-backed UX benchmarks segmented by industry, device, and visitor type provide the most meaningful comparison for strategic decision-making.
Recommended